Price recommendation for Airbnb hosts post-pandemic
Data Processing
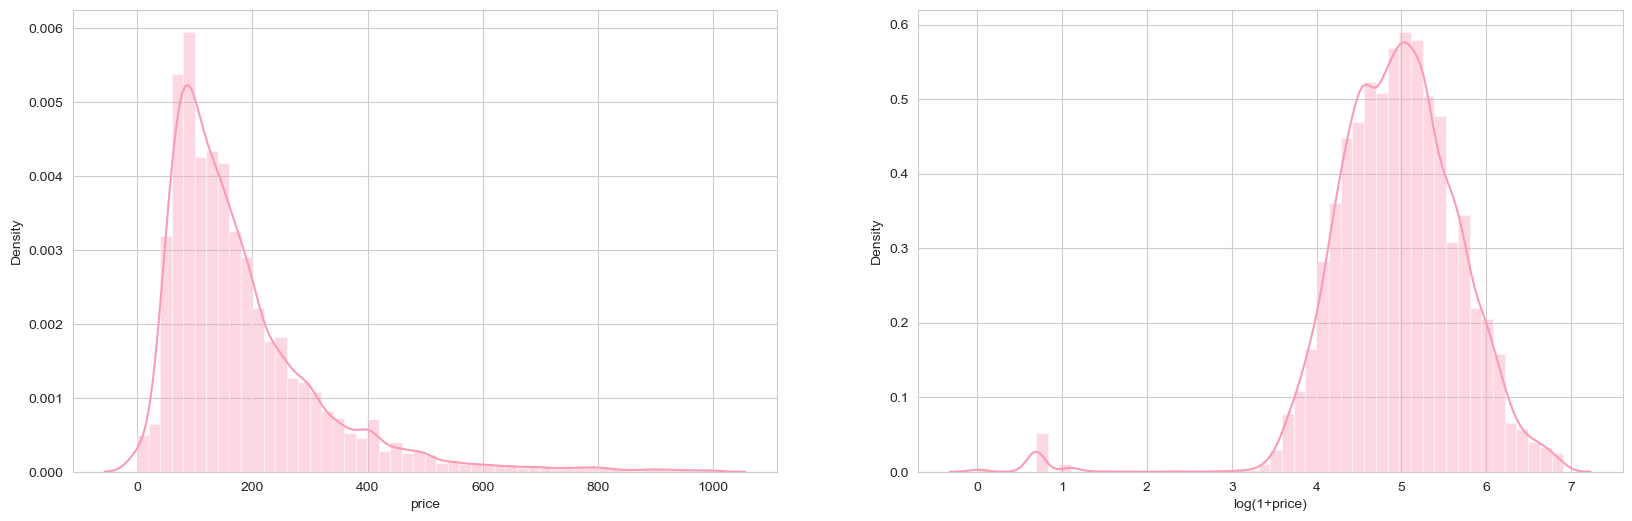
We examined the price distribution and removed those data last reviewed before 2022 to make sure we only considered those with guests in the current year. Then we removed the outliers and dropped the NA value of potential features. The final dataset contains 16013 observations.
To get a sense of the spatial distribution of Airbnb prices in New York City, we visualized the price of Airbnb by their locations.
We also plot a price map by neighborhood. The following map indicates that Airbnb prices exhibit strong spatial autocorrelation.
Feature Engineering
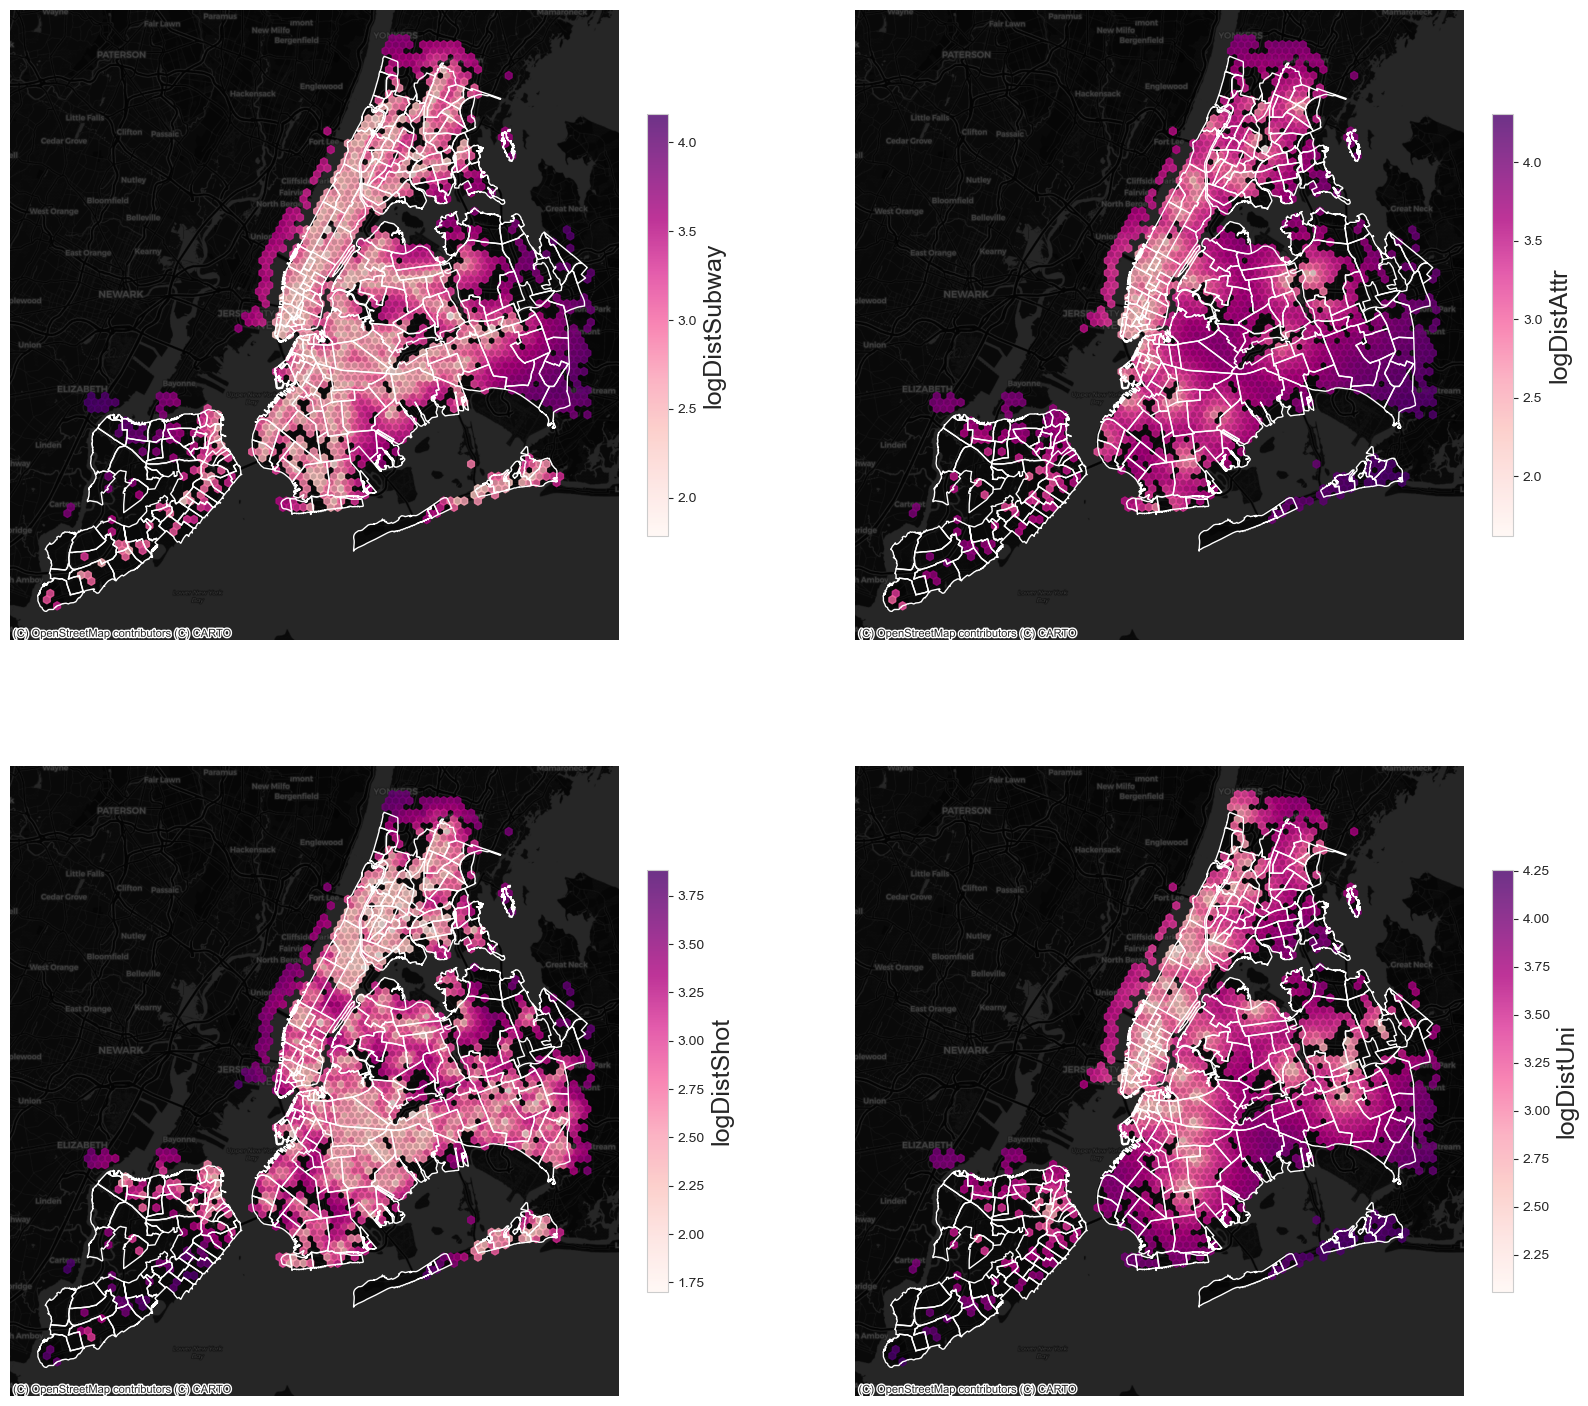
We brought in several potential variables that might influence the price of Airbnb. We got university and shooting data from NYC open data, subway stations and tourist attractions from OSM data. Below, we engineered the features and showed the distance between Airbnb and the average distance to the three nearest shooting, three nearest attractions, one nearest university, and one nearest subway station.
To eliminate the spatial autocorrelation, we developed a new feature named LaggedPrice to account for the neighborhood effect, which indicates the average price of each Airbnb’s five nearest Airbnb.
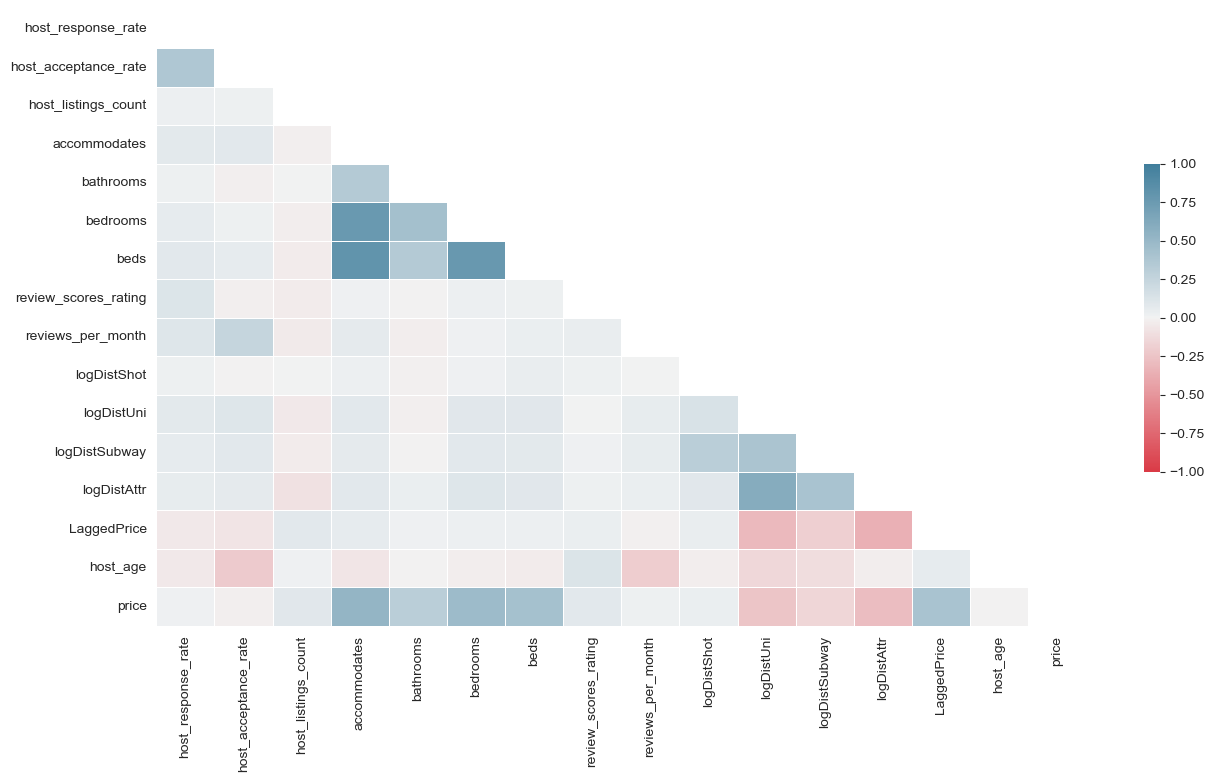
Correlation Test
We created a correlation matrix that examined the correlation between those numerical variables.
Train a Random Forest Model
We split our data into a 70% training set and a 30% test set and built a random forest model. The final variables are listed as follows:
# Numerical columns
num_cols = [
     'host_response_rate',
     'host_acceptance_rate',
     'host_listings_count',
     'accommodates',
     'bathrooms',
     'bedrooms',
     'beds',
     'review_scores_rating',
     'reviews_per_month',
     'logDistShot',
     'logDistUni',
     'logDistSubway',
     'logDistAttr',
     'LaggedPrice',
     'host_age'
]
# Categorical columns
cat_cols = [
     'host_identity_verified',
     'host_response_time',
     'neighbourhood',
     'room_type',
     'instant_bookable'
]
The result of testing score is 0.7070159774845959
A test score of 0.707 indicates that this algorithm could be an ideal predicting model. Then, We plot a bar chart of feature importance. The five most important features are the entire home/apt dummy variable, logDisAttr, LaggedPrice, bathrooms, and accommodates.
Validation
We calculated the predicted price, percent error, and absolute percent error with the test set for each observation. To further examine the spatial autocorrelation, we visualized the spatial distribution of the percent error and the mean absolute percent error by neighborhood in the test set. The errors of prediction of Airbnb price have few spatial clusters, which means the effects of spatial autocorrelation have reduced a lot.
In conclusion, this model would be a great tool for Airbnb hosts to decide their future prices. It could be built into the app and website during the listing process. There are also some improvements we could make in the future to make the model’s performance, such as considering the time effect and including more related amenity variables.