NYC’s Airbnb market change at the neighborhood level
Compare Listing Spatially before/”after” Pandemic
First, we loaded New York City neighborhood data, which served as a spatial reference for further analysis. Then we calculated the mean value of price_per_person,reviews_per_month,review_scores_rating, and bedrooms and the sum of count by neighborhood. After merging them to get geometry, we plotted each feature map in 2019 and 2022 for comparison.
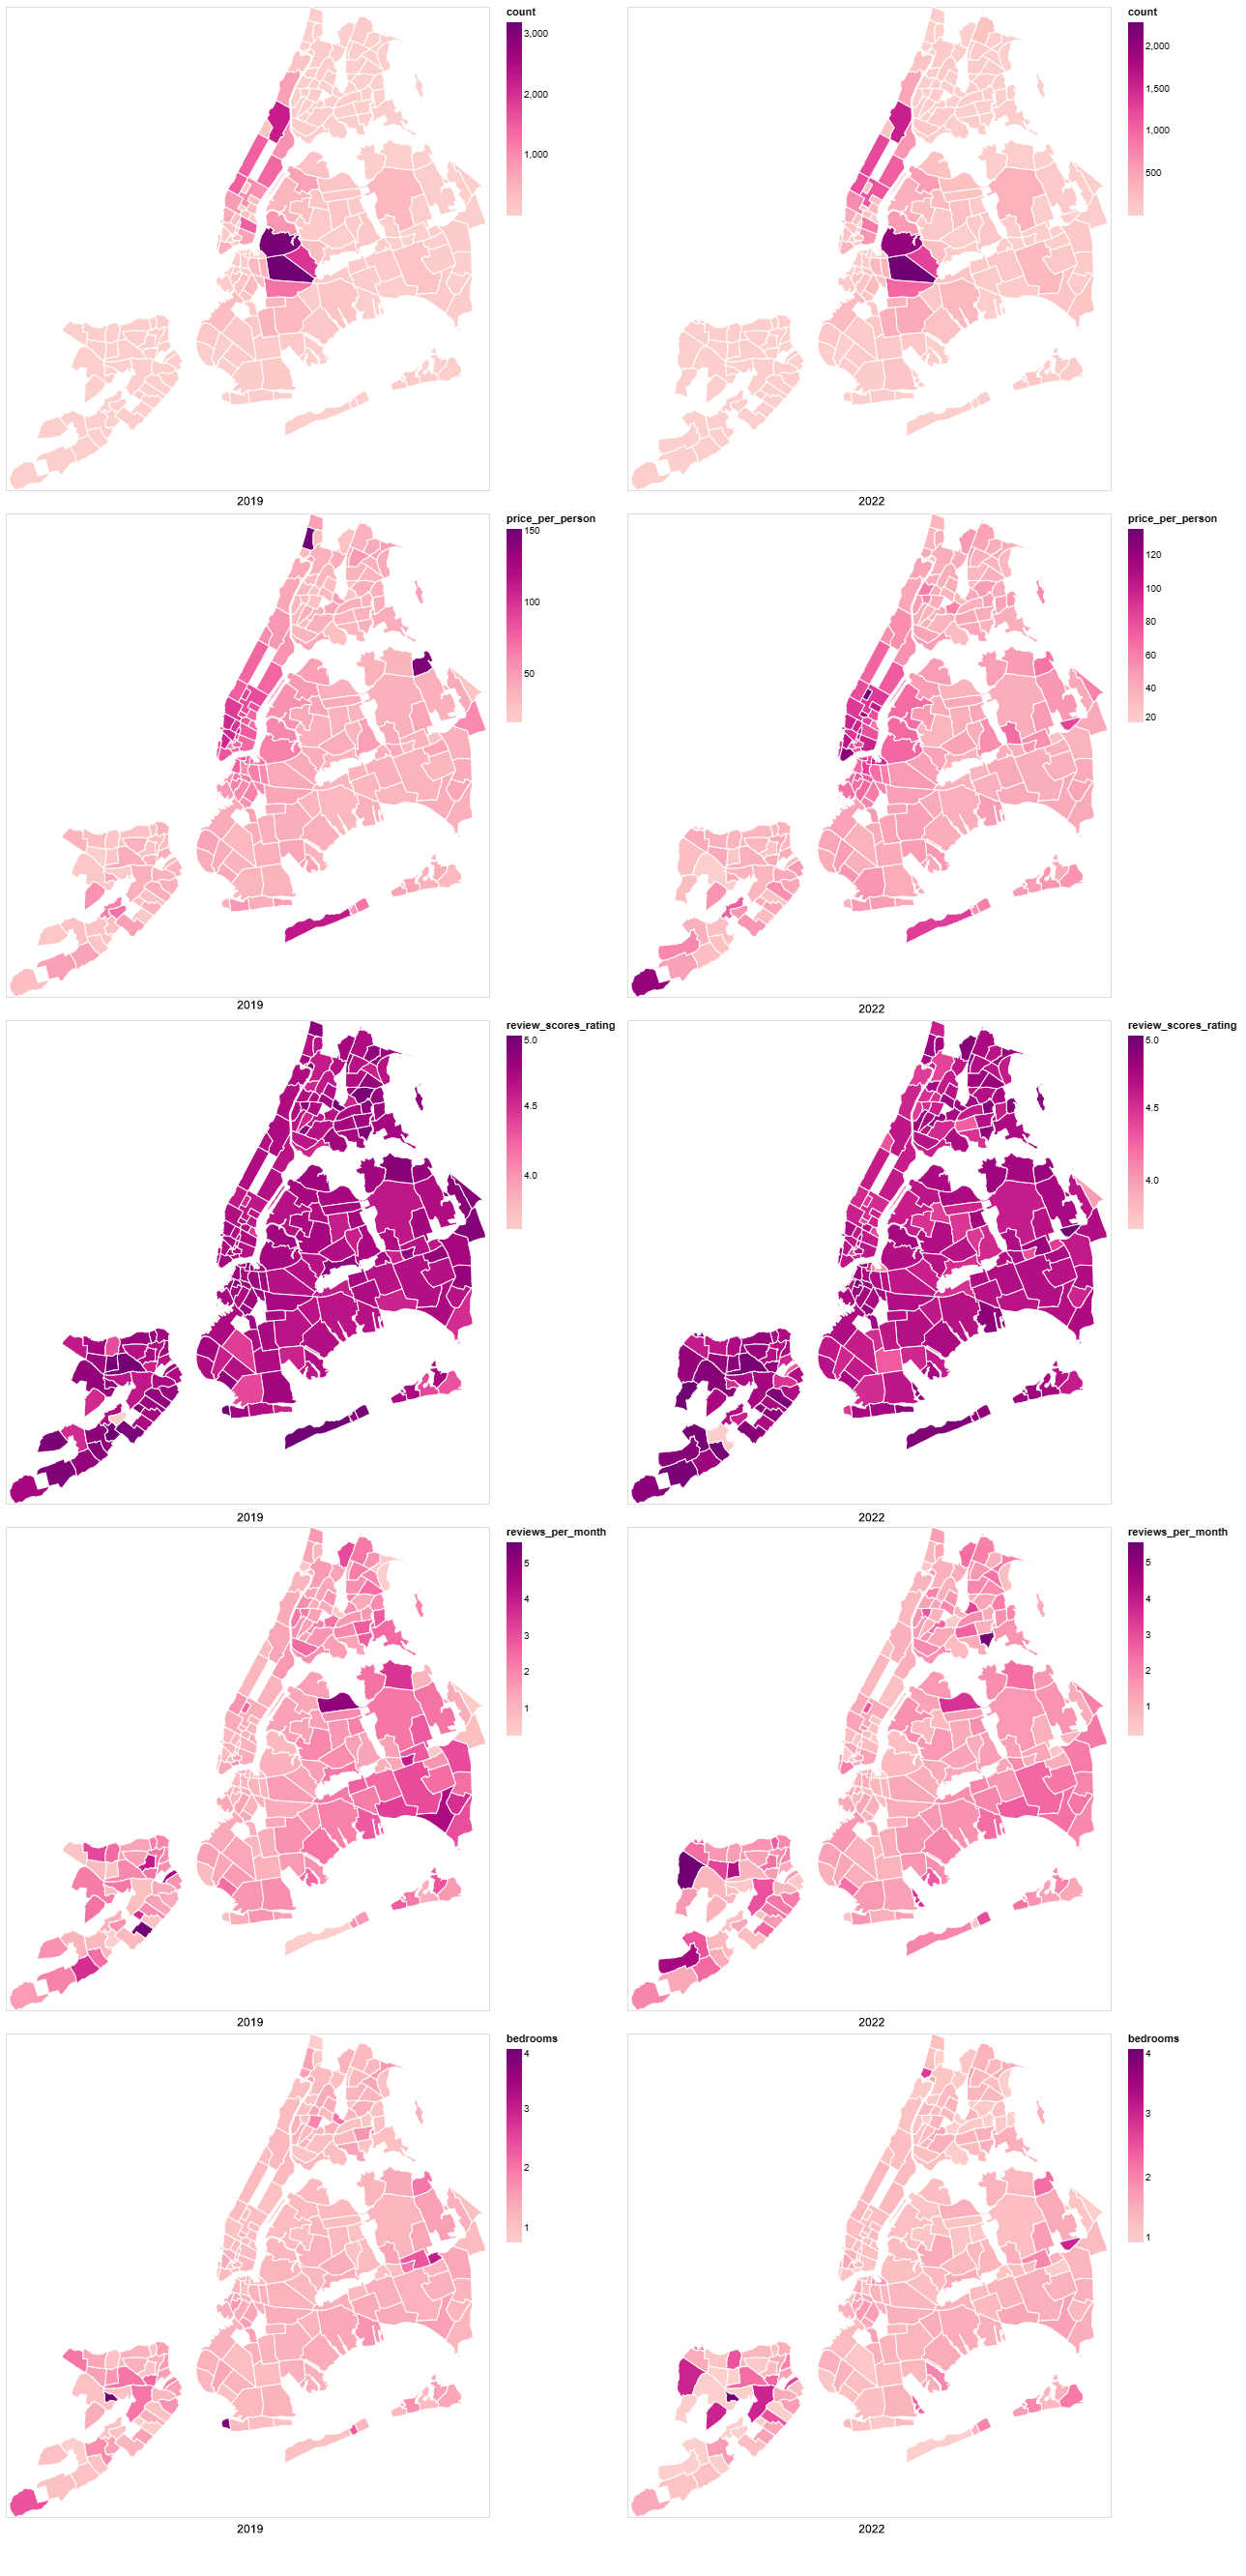
The neighborhood with the most Airbnb listing is Bedford-Stuyvesant, Williamsburg, Bushwick in Brooklyn and Harlem, Upper West Side, Hell’s Kitchen in Manhattan. This has mostly stayed the same from 2019 to 2022. There are some new neighborhoods has Airbnb businesses in 2022 Staten Island. Price overall increased, besides in a few neighborhoods, such as Riverdale, significantly decreased. The rating seems relatively even across the city. Airbnb listings in Queen get more reviews per month than in other areas. Overall, review per month significantly decreased in 2022, indicating the market still hasn’t recovered from Covid. Neighborhoods in Staten Island tend to have more bedrooms.
K-means Clustering Analysis
In this part, we clustered neighborhoods by Airbnb features, trying to find desirable neighborhoods for guests with different demands. We performed K-means cluster analysis, and the results were divided into five labels:
For each features, we could calculate the average value per cluster, the results is as follows:
group_neighbor_22.groupby('label')['count'].mean().sort_values()
- Label4: 14.400000
- Label1: 50.784091
- Label3: 94.285714
- Label0: 167.763158
- Label2: 1353.200000
group_neighbor_22.groupby('label')['price_per_person'].mean().sort_values()
- Label1: 42.493588
- Label3: 44.160675
- Label4: 44.939426
- Label2: 66.150279
- Label0: 86.746105
group_neighbor_22.groupby('label')['review_scores_rating'].mean().sort_values()
- Label3: 4.539298
- Label2: 4.606367
- Label0: 4.665889
- Label4: 4.749952
- Label1: 4.764137
group_neighbor_22.groupby('label')['reviews_per_month'].mean().sort_values()
- Label2: 1.046912
- Label0: 1.133068
- Label3: 1.194759
- Label4: 1.927789
- Label1: 1.991417
group_neighbor_22.groupby('label')['bedrooms'].mean().sort_values()
- Label3: 1.305697
- Label2: 1.343419
- Label1: 1.362601
- Label0: 1.378306
- Label4: 2.483525
Recommendations for Potential Airbnb Guests
Based on the clustering results, we divided NYC’s potential Airbnb guests into several categories and recommended different neighborhoods for each:
-
For Airbnb guests seeking a luxury experience or business trip with a high budget, the neighborhoods with label 0 might be their best option. The Airbnbs in those areas are significantly more expensive than others, but they are close to the central business area and attractions.
-
For Airbnb guests with high-budget , especially tourists, the neighborhoods with label 2 might be their best choice. The Airbnbs in those areas are relatively pricy, but there are plenty of available Airbnbs and the Airbnbs in those areas. These locations also have convenient transit and are close to famous attractions.
-
For people who pursue the highest cost-effective, the neighborhoods with label 1 might be the best since the Airbnb price per person for those areas is the lowest, and the review scores are the highest. However, Airbnbs in those neighborhoods might be in high demand since the Airbnb supply in those areas is small (low count), while the occupancy rate might be high (with a high reviews_per_month).
-
For those who need large space, the neighborhoods with label 4 might be their best choice. Those areas have more Airbnb with multiple bedrooms and great rating scores. However, the supply in those areas is the lowest.
The neighborhoods with label 3 are not quite desirable since they have small spaces and the lowest rating.