Influence of the pandemic on NYC’s Airbnb market
Data Wrangling
First, we loaded the Airbnb Listing data in September 2019 and September 2022 (from InsideAirbnb). Then we cleaned the combined datasets:
- Removed data that do not contain location information, price, reviews
- Transformed datatype of certain fields(e.g. price,host_response_rate)
- Added new field
price_per_person(price_per_person=price/accommodates) anddata_yearinto our Airbnb dataset. - Adjust the 2019 price with a 1.16 inflation rate
- Combined two listing datasets into one for comparison
Compare Listing before/”after” Pandemic by Neighbourhood Group
Below, we plot different parameters of NYC’s Airbnb market in 2019 and 2022 by neighborhood groups.
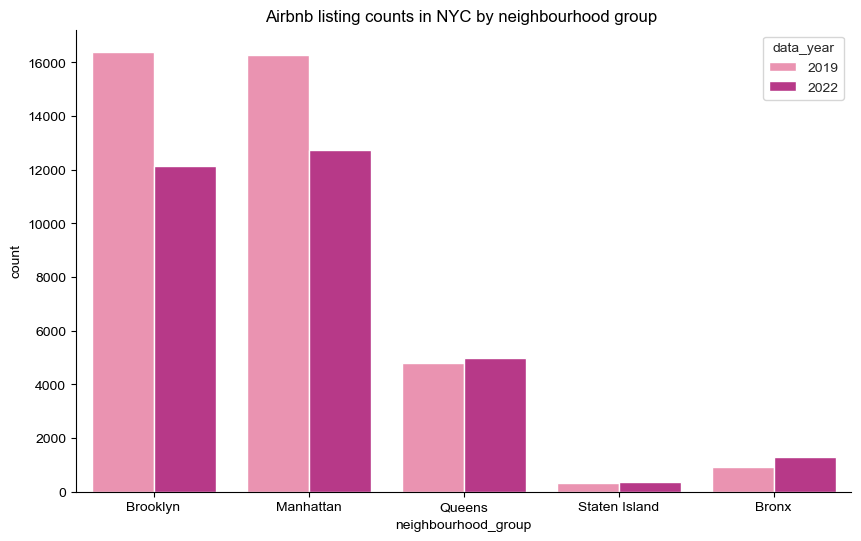
The total valid listing number has dropped from 39k in 2019 to 32k in 2022. The listing counts significantly decreased in Brooklyn and Manhattan, where most Airbnb listings are located. Interestingly, the listing counts in the Bronx, Queens, and Staten Island increased in 2022.
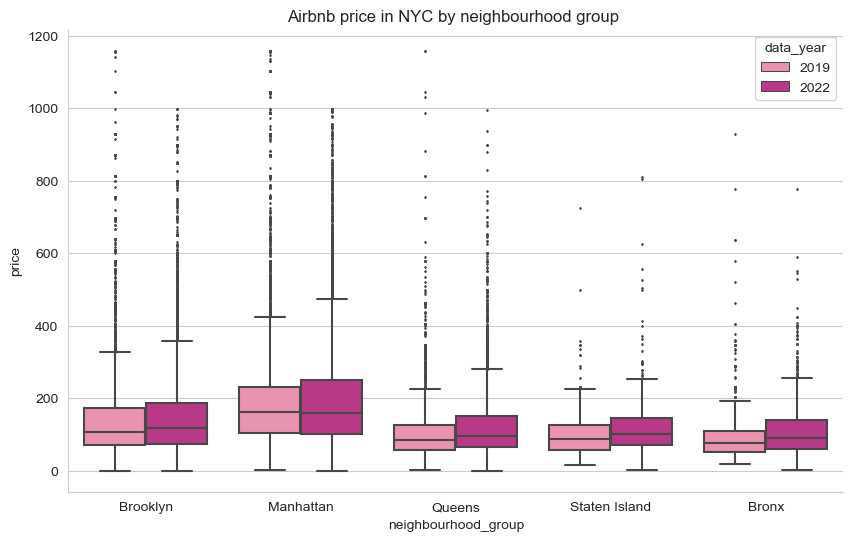
Overall, Airbnb prices increased at all neighborhood groups in NYC in 2022, even though inflation is already considered. In Manhattan, the median price is slightly lower than before Covid, but there are more higher-priced listings. The price of Queens and Bronx has increased a lot. Combined with the information we got with listing counts, people might be more willing to stay in Queens, Bronx, and Staten Island than before Covid.
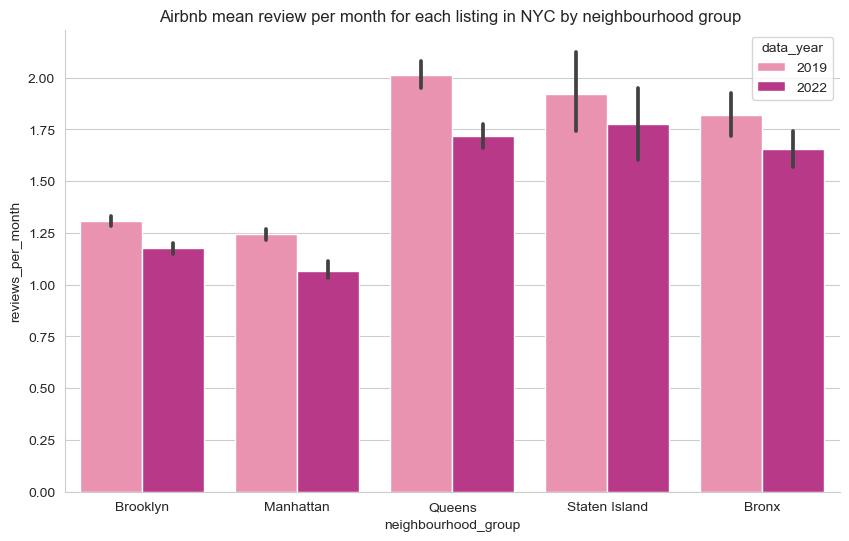
According to Airbnb, about 70% of guests leave reviews. We can learn how Airbnb market activities changed by looking at mean review_per_month. There are fewer reviews per month in all neighborhood groups in NYC, indicating fewer guests in 2022 than in 2019.
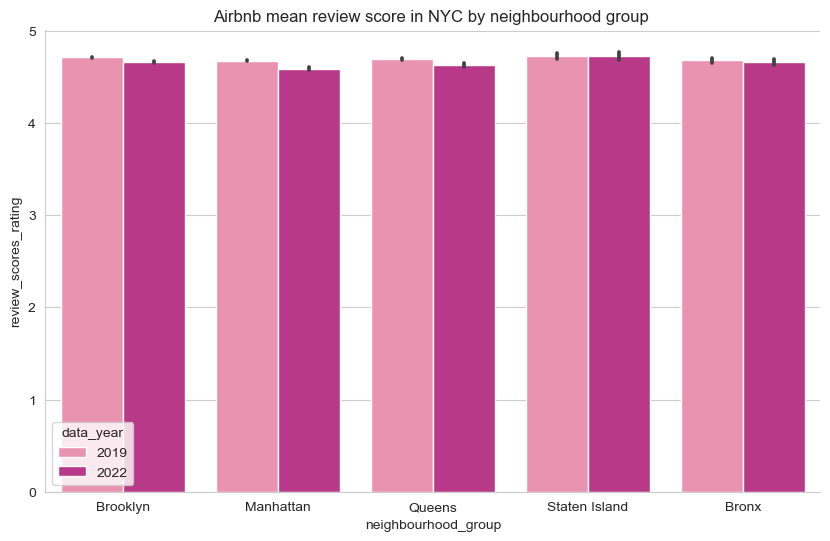 Airbnb’s mean review score in NYC dropped in 2022, especially in Manhattan, Queens, and Brooklyn. This shows that guests are overall less satisfied with their stay at Airbnb than before Covid.
Activities during Pandemic
The listing data analysis above allows us to learn how NYC’s Airbnb market has changed from 2019 to 2022. However, it doesn’t show how the market flustrated during the pandemic. To figure out market activities with Covid conditions, we brought in the Airbnb Review data in September 2019 (from InsideAirbnb). Since the data is over 1,000,000 rows, we used dask to load and process the data and get how many reviews each month from February 2020 to August 2022.
Also, we loaded COVID-19 Daily Counts of data (from NYC OpenData). Then, we calculated the sum of cases, hospitalizations, and deaths each month from February 2020 to August 2022.
Below, we combined the review data and Covid data by month to compare.
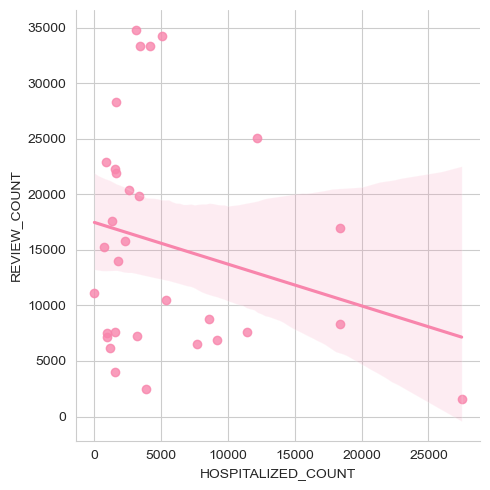
The linear regression shows that Covid-19 hospitalized counts negatively correlate to Airbnb review counts.
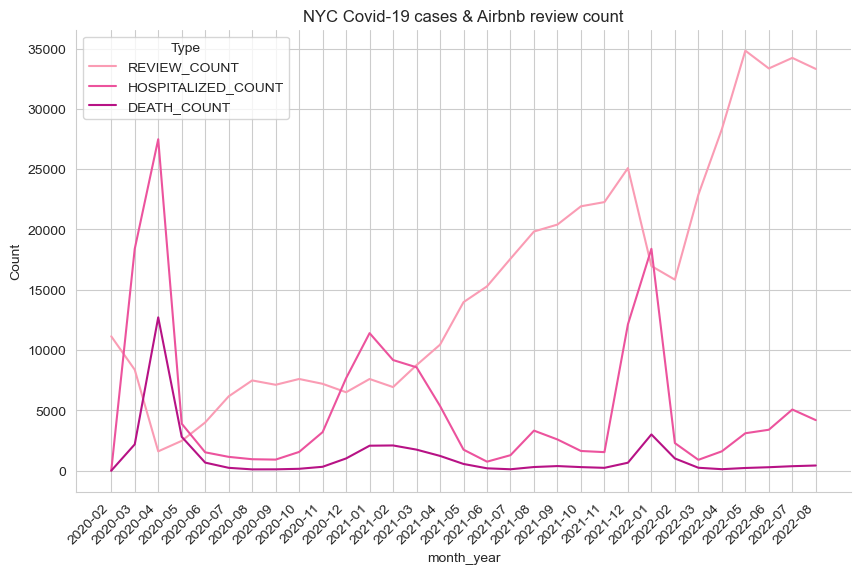
The line plot for NYC Covid-19 cases and Airbnb review count over time shows the Airbnb market during the pandemic is closely related to Covid conditions. When there was an outbreak of Covid and hospitalized and the death count increased, there was a drop in the Airbnb review count. The hit at the beginning of Covid-19 and January 2022 had particularly strong impacts.